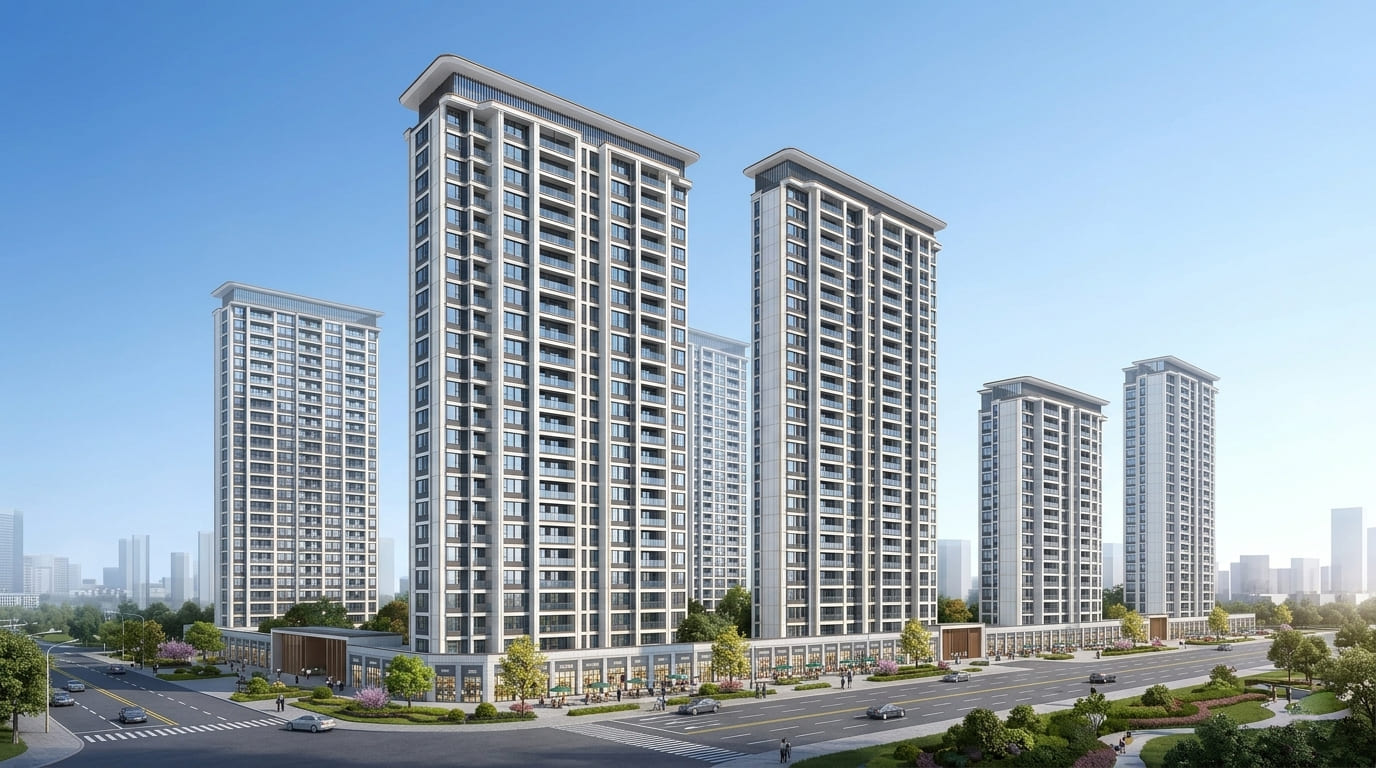
China's real estate market continued its phase of correction in 2025, a trend that began in previous years. The latest data released by the National Bureau of Statistics shows a continued contraction, but also some initial signs of stabilization. Let's break down the key indicators.
Investment and Construction: Activity Slows
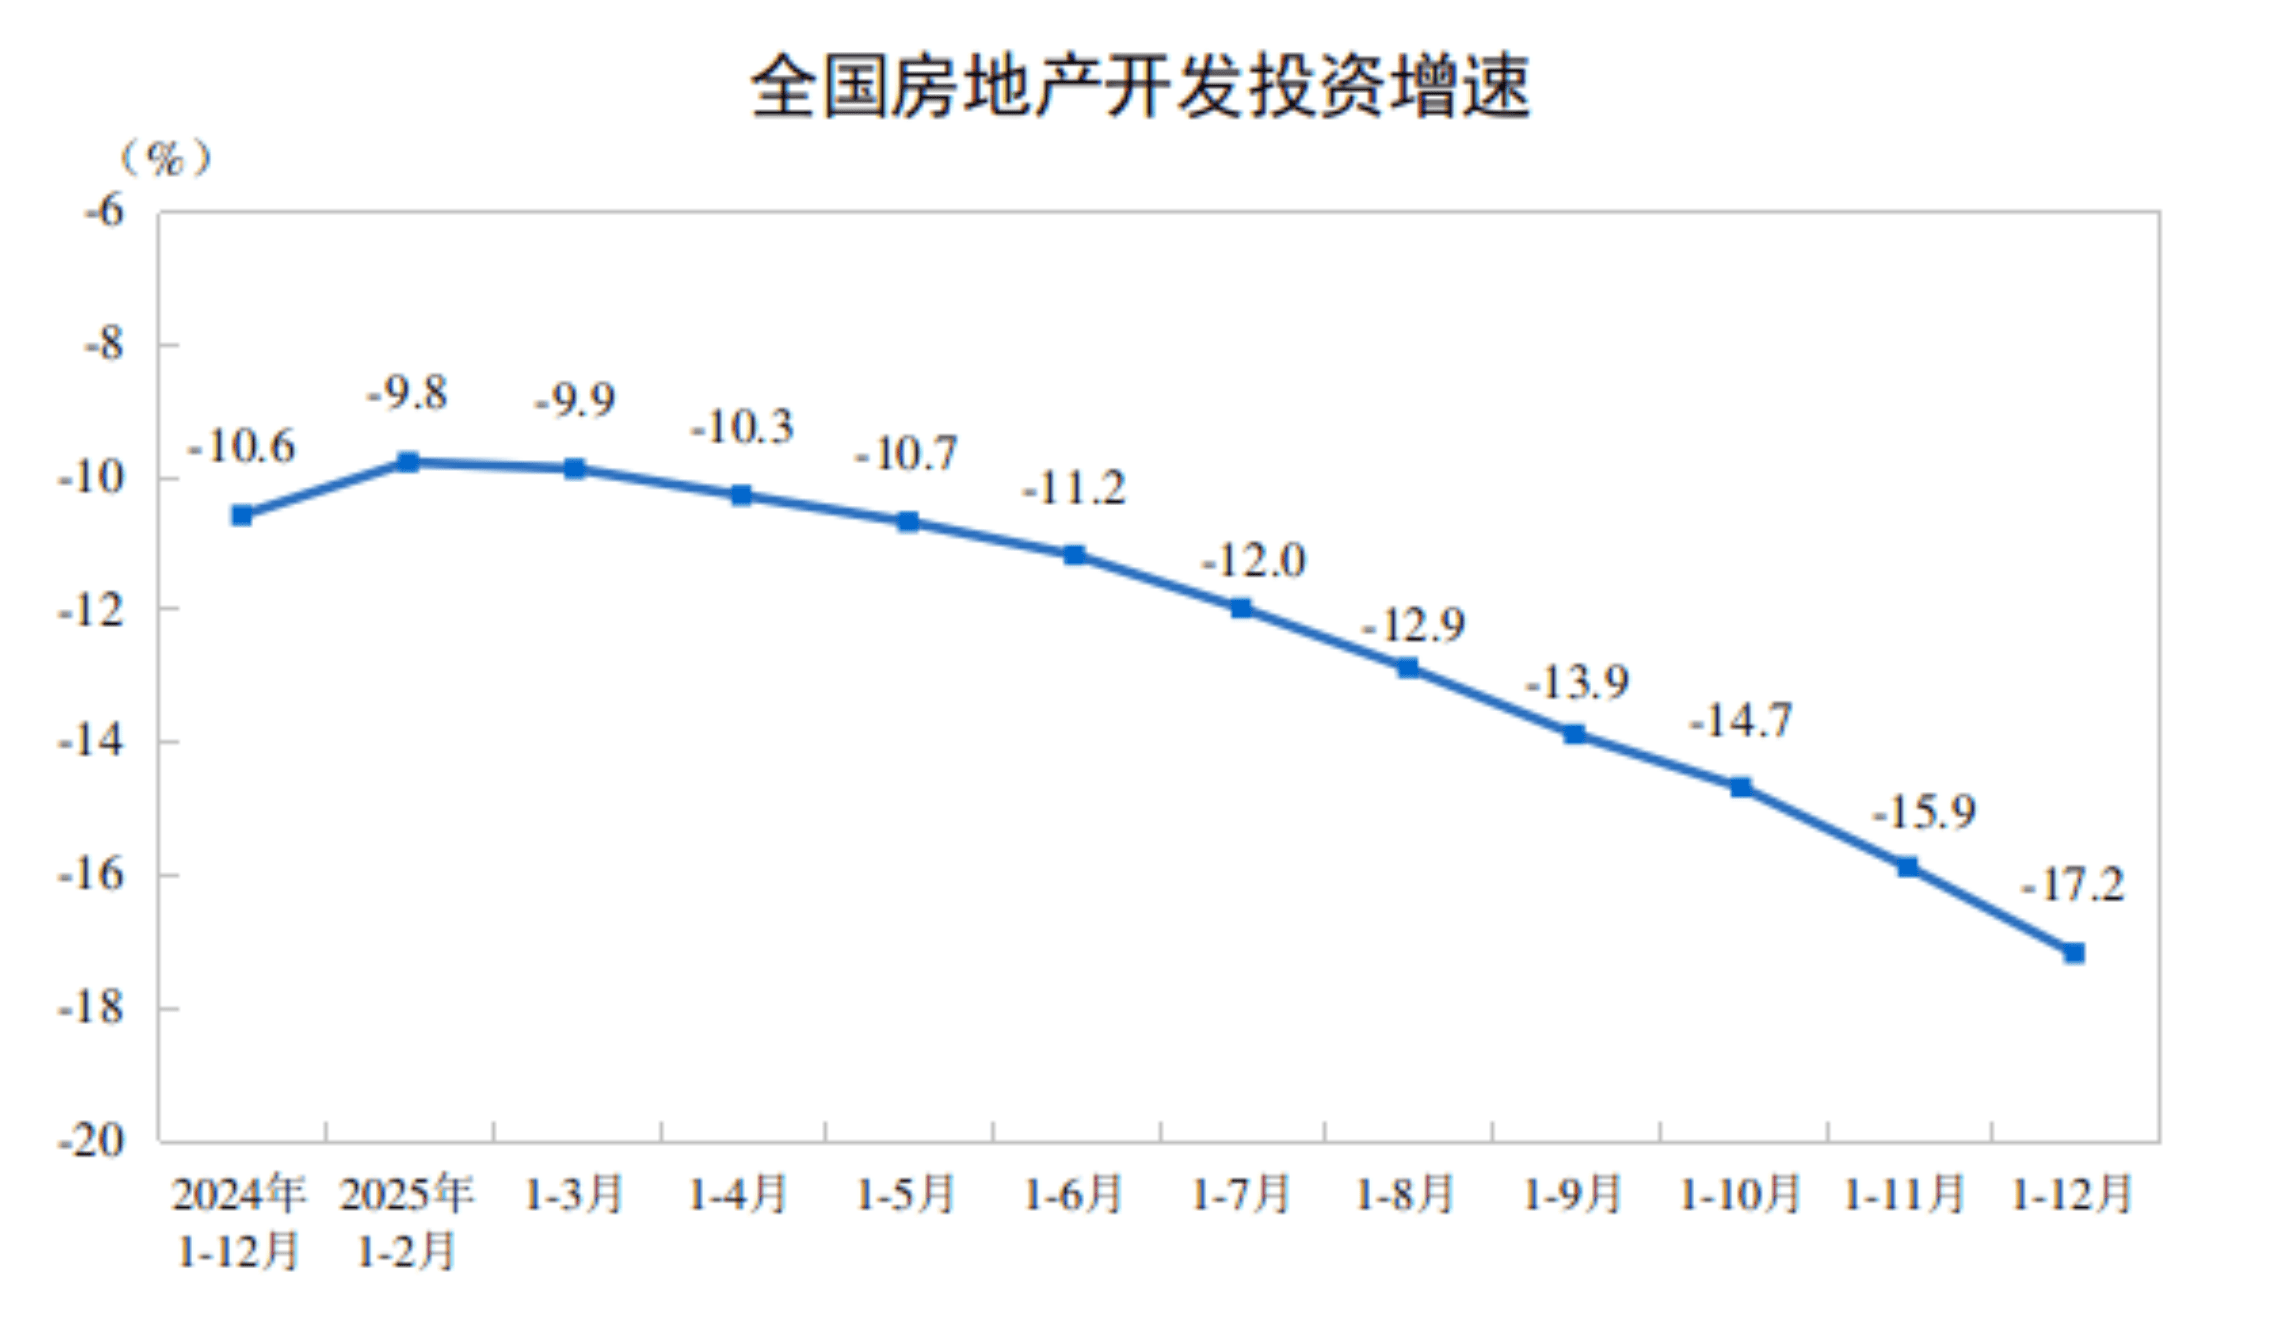
In 2025, total real estate development investment reached 8.28 trillion yuan, down 17.2% from 2024. Investment in residential housing fell by 16.3% to 6.35 trillion yuan. This reflects developers' cautious approach to launching new projects under current demand conditions.
The construction sector also showed a slowdown:
- Newly started floor space: 587.7 million sq m (–20.4%)
- Total floor space under construction: 659.9 million sq m (–10.0%)
- Completed floor space: 60.35 million sq m (–18.1%)
Note: These figures indicate a planned adjustment in construction volumes after a decade of boom, not a sudden collapse.
Sales: The Decline is Slowing
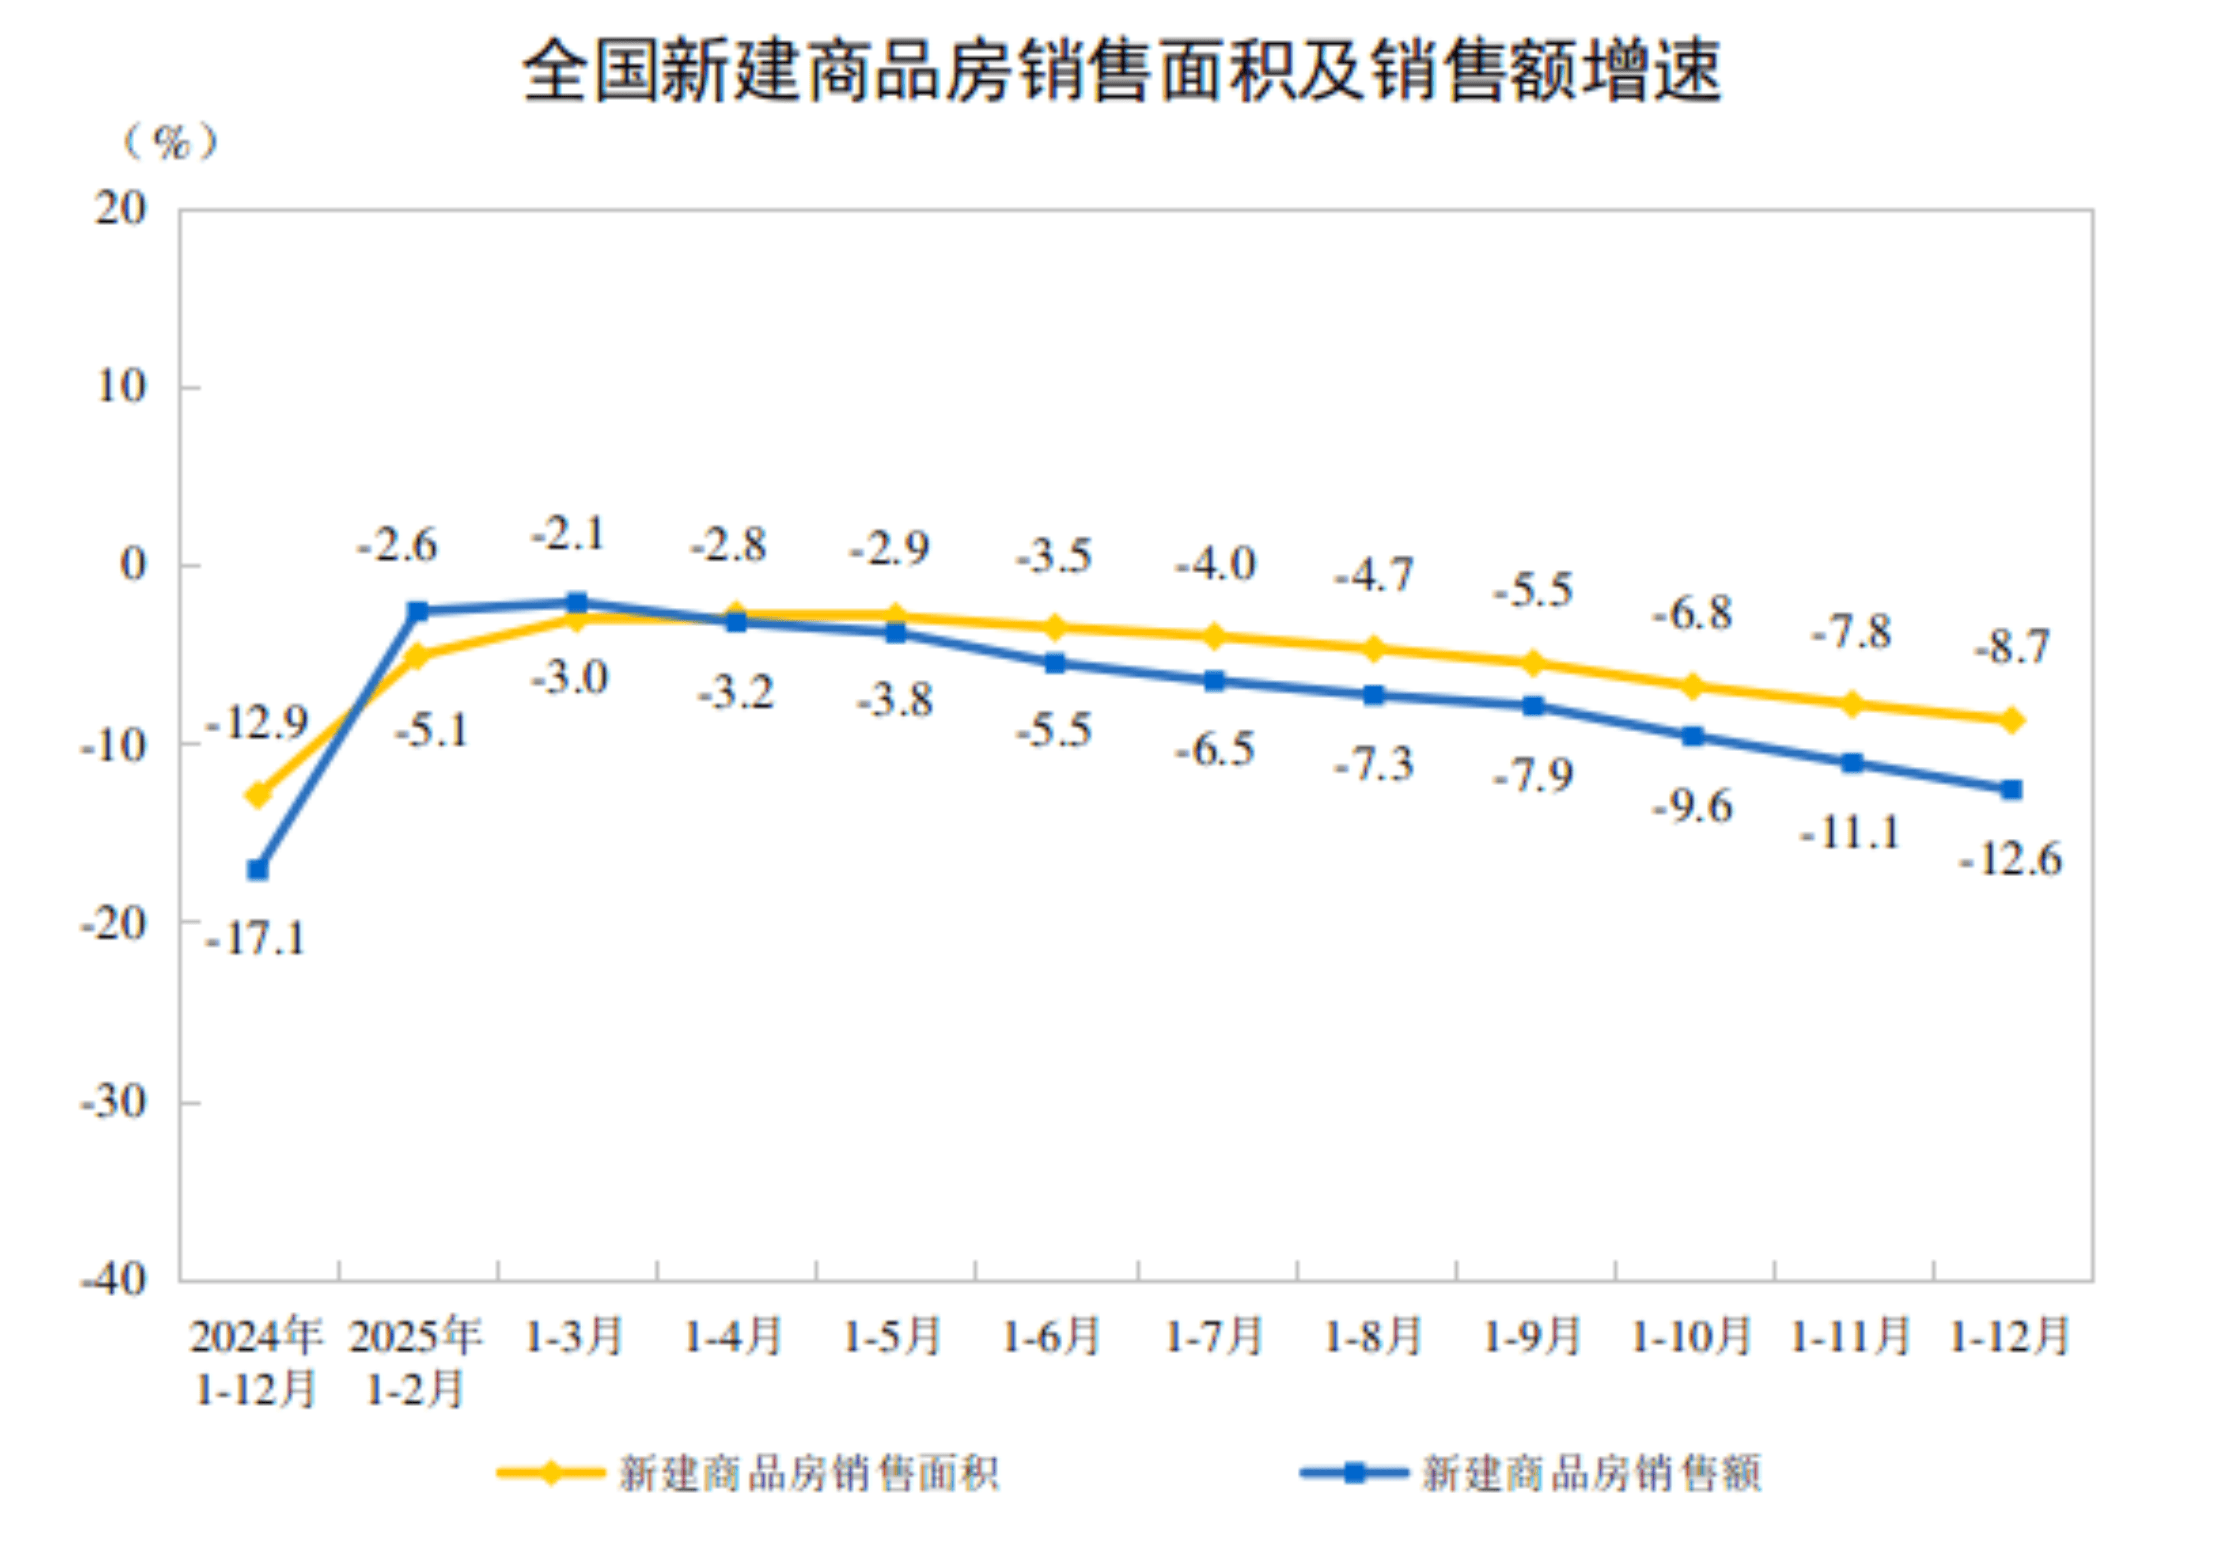
■ Yellow line — growth rate of new commercial housing sold by floor area (sq m).
■ Blue line — growth rate of new commercial housing sales value (yuan).
The sales market showed more moderate dynamics compared to the construction sector:
- Floor space sold: 88.1 million sq m (–8.7%)
- Total sales revenue: 8.39 trillion yuan (–12.6%)
The difference between the decline in physical volume (–8.7%) and the decline in revenue (–12.6%) points to some price pressure — which could create opportunities for buyers.
Unsold Inventory: Stabilizing at Year-End
At the end of 2025, unsold commercial housing inventory stood at 76.63 million sq m, up 1.6% from the previous year. However, compared to November, the growth rate of inventory slowed by 1 percentage point — a positive signal, possibly indicating a slight pickup in demand in the final month of the year.
Developer Finances: Pressure Remains
Total funds received by developers fell by 13.4% to 9.31 trillion yuan. Key funding sources changed as follows:
- Individual mortgage loans: –17.8%
- Deposits and presales (down payments): –16.2%
- Self-raised funds: –12.2%
This reflects both cautious lending by banks and more conservative behavior by buyers.
Real Estate Climate Index: Below Normal but Stable
In December 2025, the Real Estate Climate Index stood at 91.45 (with 100 = optimal level). A reading below 95 indicates low activity. Nevertheless, the index has remained stable over recent months, showing no sharp decline.
Official Data Table
Table 1: National Real Estate Development and Sales in 2025
| Indicator | Absolute Value | Year-on-Year Change (%) |
|---|---|---|
| Real Estate Development Investment (100 million yuan) | 82,788 | –17.2 |
| – Residential | 63,514 | –16.3 |
| – Office Buildings | 3,203 | –22.8 |
| – Commercial Premises | 5,947 | –14.0 |
| Floor Space Under Construction (10,000 sq m) | 659,890 | –10.0 |
| – Residential | 460,123 | –10.3 |
| – Office Buildings | 27,979 | –6.2 |
| – Commercial Premises | 56,975 | –9.8 |
| Floor Space Newly Started (10,000 sq m) | 58,770 | –20.4 |
| – Residential | 42,984 | –19.8 |
| – Office Buildings | 1,471 | –21.9 |
| – Commercial Premises | 3,805 | –23.5 |
| Floor Space Completed (10,000 sq m) | 60,348 | –18.1 |
| – Residential | 42,830 | –20.2 |
| – Office Buildings | 2,071 | +6.7 |
| – Commercial Premises | 4,259 | –12.9 |
| Floor Space of New Commercial Buildings Sold (10,000 sq m) | 88,101 | –8.7 |
| – Residential | 73,299 | –9.2 |
| – Office Buildings | 2,239 | –6.2 |
| – Commercial Premises | 5,353 | –9.5 |
| Sales Value of New Commercial Buildings (100 million yuan) | 83,937 | –12.6 |
| – Residential | 73,335 | –13.0 |
| – Office Buildings | 2,900 | –9.3 |
| – Commercial Premises | 4,991 | –11.7 |
| Floor Space of Unsold Commercial Buildings (10,000 sq m) | 76,632 | +1.6 |
| – Residential | 40,236 | +2.8 |
| – Office Buildings | 5,330 | +0.3 |
| – Commercial Premises | 14,247 | –1.4 |
| Funds Available to Developers (100 million yuan) | 93,117 | –13.4 |
| – Domestic Loans | 14,094 | –7.3 |
| – Foreign Investment | 25 | –20.8 |
| – Self-raised Funds | 33,149 | –12.2 |
| – Deposits and Presales | 28,089 | –16.2 |
| – Individual Mortgage Loans | 12,852 | –17.8 |
Source: National Bureau of Statistics of China, January 19, 2026
Summary: Searching for a New Equilibrium
China's real estate market is undergoing a deep but expected transformation. Key indicators (investment, construction, sales) have been contracting for the second consecutive year, reflecting a transition from rapid growth to greater balance.
Key features of the current stage:
- Declining demand and weaker confidence in developers amid economic uncertainty
- Developers adapting to new conditions: reducing new construction starts and focusing on completing existing projects
- Moderate growth in unsold housing inventory, which stopped accelerating by year-end
Government support measures (rate cuts, easing for developers, demand stimulus in major cities) have not yet reversed the trend, but they are helping to avoid a sharp escalation of the crisis. 2026 will likely be a period when the market continues to search for a bottom and builds a base for future recovery.
Source: 2025年全国房地产市场基本情况 — National Bureau of Statistics of China (published January 19, 2026).